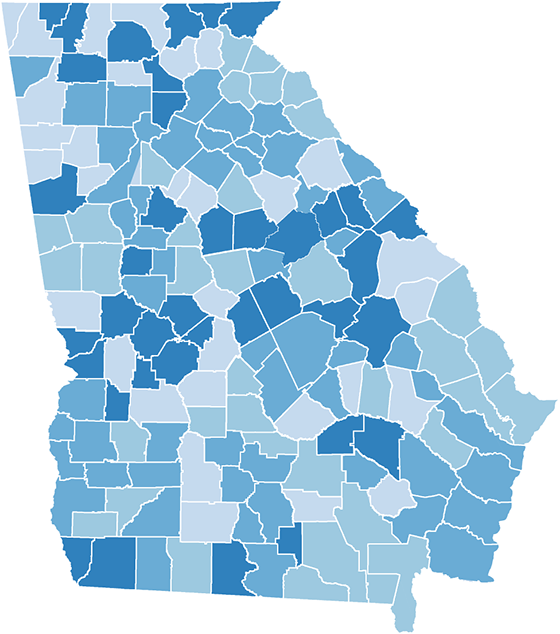
Ben's Family

We don't want to burden the tax payers with huge costs, but we can't bear the full cost of autism so it will have to be the public’s responsibility.
➕
Read More
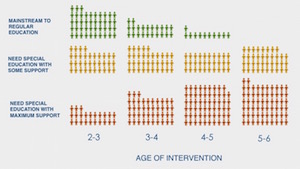
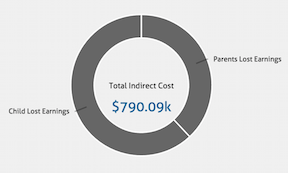
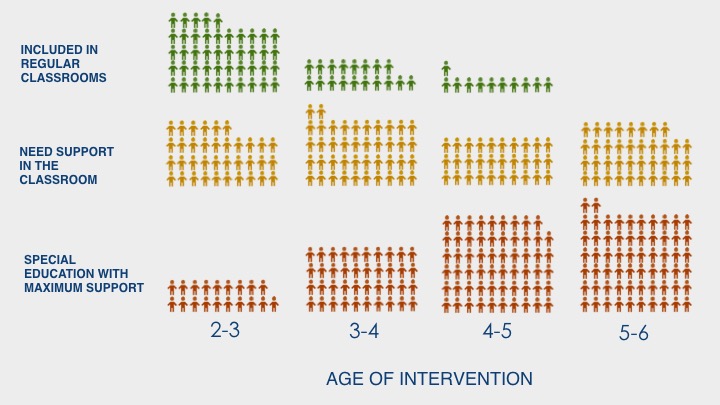
Early treatment saves up to $1.3 million over a lifetime
Photo credit: ©iStock.com/Linda Epstein
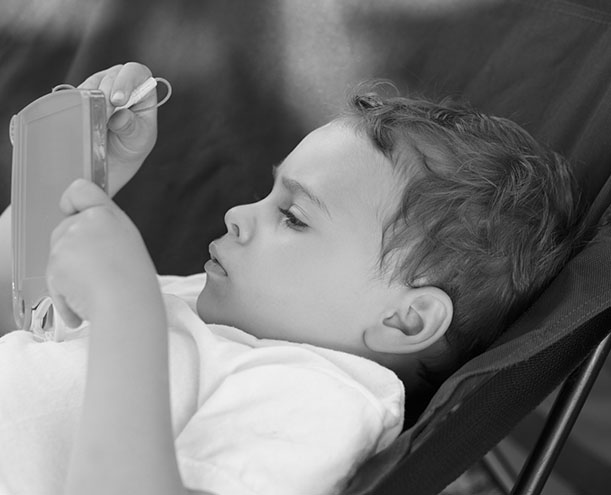
My name is John and my son, Ben, was diagnosed with autism at 4 years old.*
When Ben was young, he had a lot of trouble sleeping and behavioral issues. Around his third birthday, things became more difficult, so we visited our pediatrician, who suggested we get him evaluated for autism. It took a while for us to get the evaluations, which cost us around $3,000 out of pocket. But finally after about a year of waiting we got the diagnosis: Ben had autism.
When we knew what was going on, we tried to get Ben into one-on-one treatment. The main issues we found were that our insurance didn’t cover those services. Everywhere we looked our best option was to get on a waitlist for treatment. After being on several waitlists a year, we finally got Ben into a treatment program, which cost us about $33,000 a year.
Ben has improved, but all the therapies and extra costs are a huge financial burden. Almost every financial decision we make is dominated by the diagnosis. My wife can no longer work because of how much support he needs. It’s hard to manage our finances—we’re stretched really thin. It’s hard too, because we don’t want to burden the taxpayers later with huge costs, but at the same time we cannot bear the full cost of autism and so, it will have to be the public’s responsibility eventually.
* This story is based on a composite to protect the privacy of families who shared their stories with us. All information is real and accurate.